Hospital Service Areas and Transportation
An Analysis Map
Project Overview
This project utilizes geospatial analysis to illustrate the accessibility of healthcare services and public transportation within distinct areas, and to correlate these services with local income levels. The primary objectives include mapping hospital service areas using Voronoi tessellations to understand the geographical distribution of healthcare facilities, delineating public transportation service areas through a 1-mile buffer analysis around transit stops, and dynamically representing local income data with an interactive chart. These methods collectively provide a visual and quantitative evaluation of healthcare and transportation disparities among various socioeconomic groups, revealing the potential relationships between accessibility to essential services and economic conditions.
Key Findings - Case Study Examples

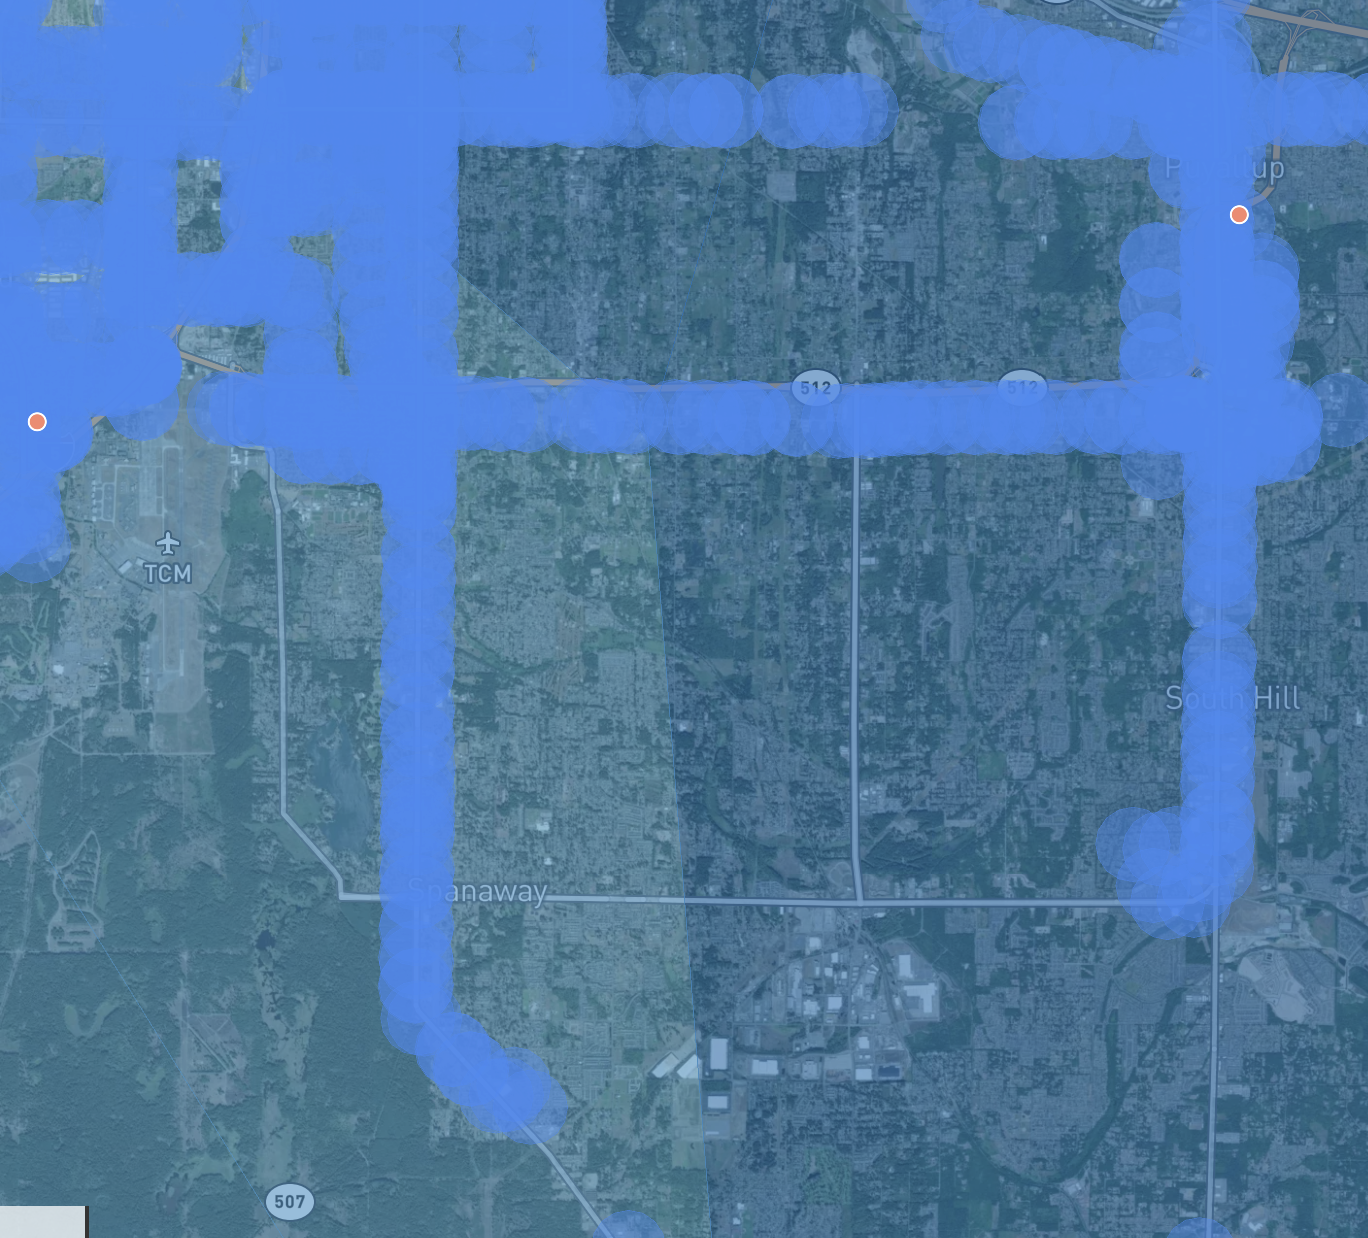
TACOMA, WA - Some urban neighborhoods may not be well-served by public transportation due to inadequate planning or funding. Residents in these "transit deserts" such as the Midland neighborhood in Tacoma, may find it difficult to reach hospitals and clinics without personal vehicles.

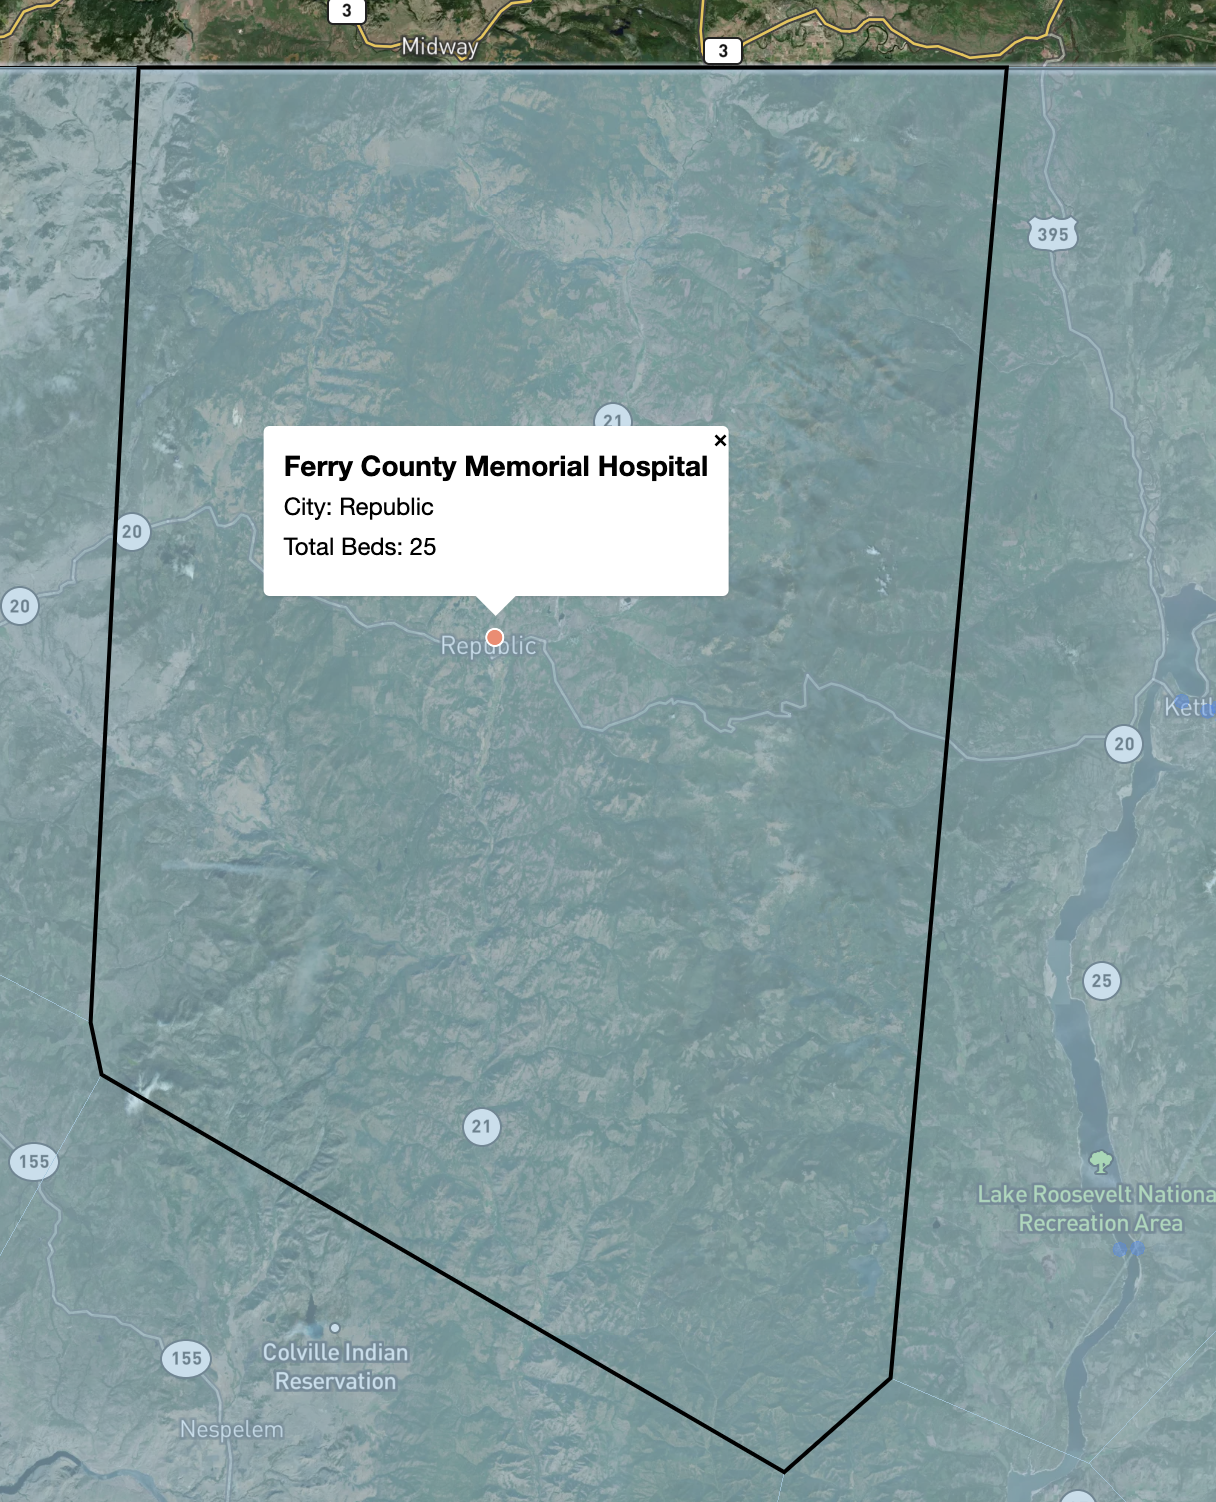
REPUBLIC, WA - The buffer analysis showed that several areas, especially those distant from city centers, have limited access to public transportation, which could hinder access to healthcare facilities to community members. It was revealed that the city of Republic, WA has no infrastruction for bus stops whatsoever.

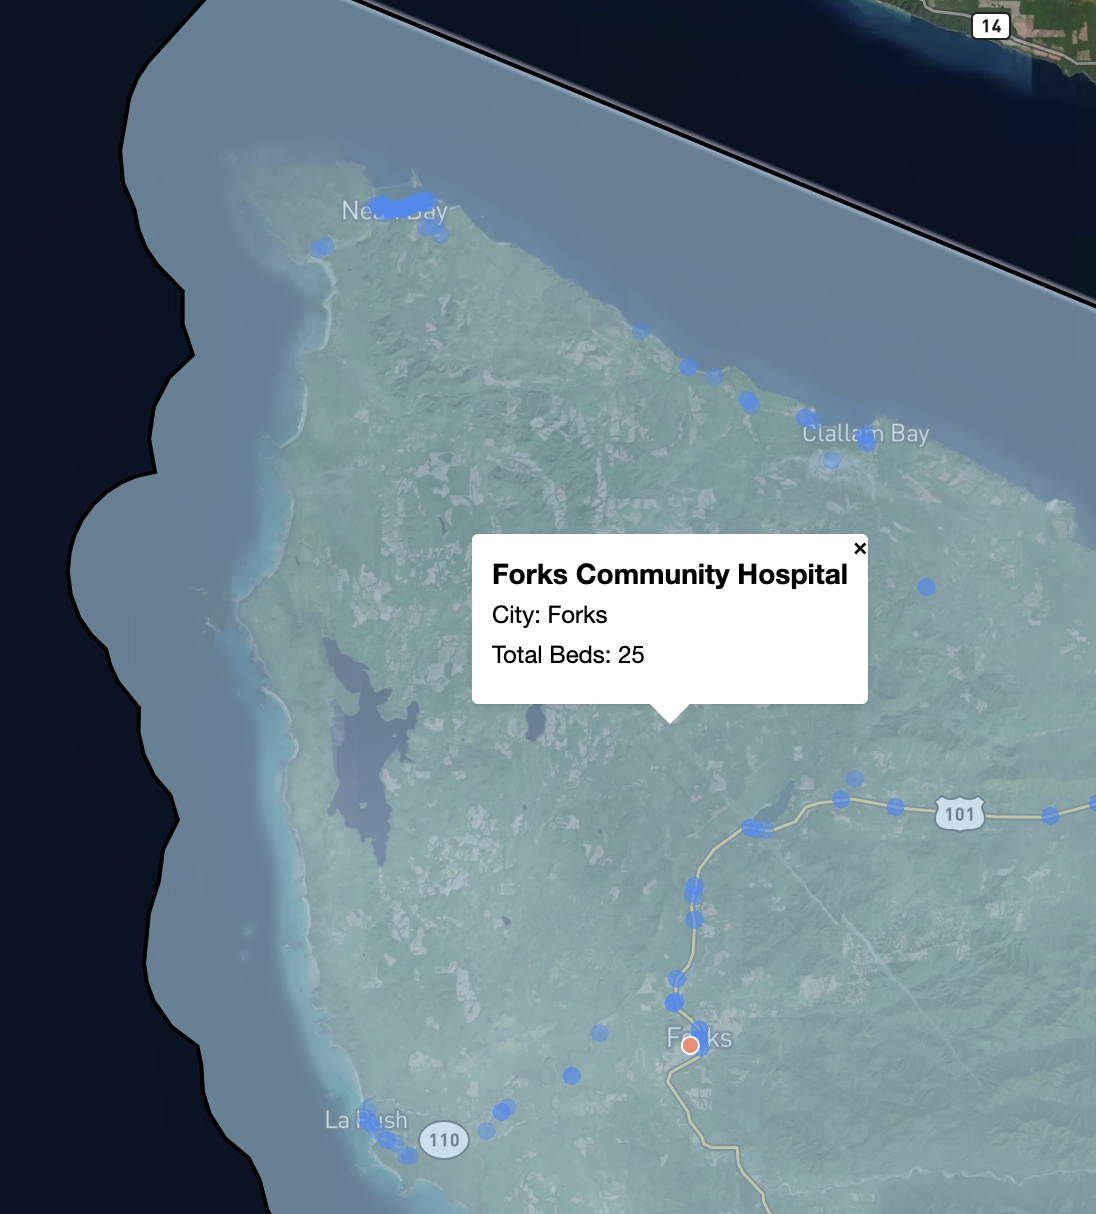
MAKAH RESERVATION - Geographic barriers such as rivers and highways were found to significantly impact the accessibility of both healthcare and public transportation, with certain natural and man-made features creating literal barriers to service areas. The Indian reservation of the Makah Tribe in Neah Bay has no hospitals and are limited in road access to the closest hospital in Forks, WA
What I did
- Data Cleaning with GeoPandas: Utilized GeoPandas in Python for geospatial data manipulation to clean and standardize hospital and transit stop datasets.
- Geospatial Analysis with Turf.js and GIS: Applied Turf.js for geospatial operations in the browser and GIS for spatial relationship analysis, generating Voronoi tessellations for hospital service areas.
- Buffer Analysis for Transit Accessibility: Performed 1-mile buffer analysis around transit stops to identify accessible areas for public transportation to healthcare services.
- Map Visualization with Mapbox: Created interactive map visualizations using Mapbox, integrating Voronoi and buffer layers onto a satellite map.
- Dynamic Data Visualization: Built an interactive chart using C3.js to display income data and visualize disparities, ensuring real-time updates based on map interactions.
- Synthesized Comprehensive Analysis: Combined geospatial analysis with socioeconomic data to offer insights into healthcare accessibility and transportation equity.